weatherData is a collection of functions that will fetch weather (Temperature, Pressure, Humidity etc.) data from the Web for you as clean data frame.
Example showing the use of getWeatherForYear()
library(weatherData)
Usage: getWeatherForYear("station_id", "YYYY")
First, we get two data frames, with one year's worth of temperature data in each. (365 rows each.) Note that getWeatherForYear is a function in the weatherData package.
city1 <- "ORD"
city2 <- "SFO"
df1 <- getWeatherForYear(city1, 2013)
df2 <- getWeatherForYear(city2, 2013)
Given two dataframes that contain daily temperatures (mean, min and max), we are simply taking the vectorized differences and creating another data frame.
getDailyDifferences <- function(df1, df2){
  Delta_Means <- df1$Mean_TemperatureF - df2$Mean_TemperatureF
  Delta_Max <- df1$Max_TemperatureF - df2$Max_TemperatureF
  Delta_Min <- df1$Min_TemperatureF - df2$Min_TemperatureF

  diff_df <- data.frame(Date=df1$Date, Delta_Means, Delta_Max, Delta_Min)
  return(diff_df)
}
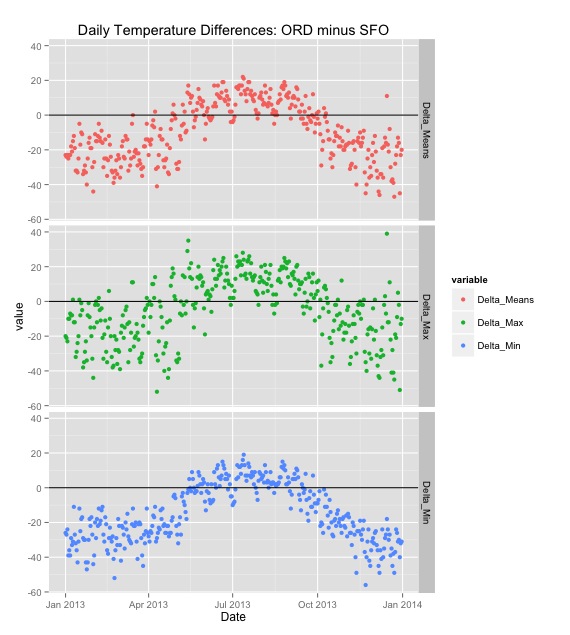
Next, let's write a small function using ggplot to plot the daily differences. We will use 3 facets, one each for Mean, Max and Min difference.
plotDifferences <- function (differences, city1, city2) {
  library(reshape2)
  m.diff <- melt(differences, id.vars=c("Date"))
  p <- ggplot(m.diff, aes(x=Date, y=value)) + geom_point(aes(color=variable)) +
    facet_grid(variable ~ .) +geom_hline(yintercept=0)
  p <- p + labs(title=paste0("Daily Temperature Differences: ", city1, " minus ",city2))
  print(p)
}
With these two functions in place, given any two cities, we can create the difference data frame and plot the differences. Let's try it for Chicago and San Francisco.
differences<- getDailyDifferences(df1, df2)
plotDifferences(differences, city1, city2)
And here's the resulting plot: